# Enabling license logging
Detailed information about license consumption and optimize license usage can be identified by License usage logging.
```
TestProgramConfig config;
config.enableLicenseLogging = true;
testProgram.loadWithConfig(config);
```
### About this task
To be able to get detailed information about license consumption and optimize license usage, it is necessary to analyze the licensing requirements for memory and speed for each measurement within a test program. From this information, it is then possible to isolate the main license requirements.
License usage logging (incremental over measurements and per measurement logging) provides the information required to establish the licensing dependencies. If the watermark increases in proportion to the measurement data, the test is independent, otherwise it shares data with other tests.
Log data is written to:
`/opt/hp93000/soc/system/log/licenseUsage_.log`
To read in the data you need to generate a parser based on protobuf library using the grammar in:
`/opt/hp93000/soc/system/include/xoc/profiling/licenseUsage.proto`
An existing file is not overwritten - only new data is appended to the existing content.
The most valuable data collected by license logging is when you have not previously executed an initial bind before executing the profile configuration. After an initial bind, only dynamic changes are recorded.
### Before you begin
Make sure the test program has been loaded.
License logging can only be enabled using a Profile launch configuration.
### Procedure
1. Select a test program or testflow in the **Package Explorer** view for which you want to enable license logging.
License logging is not available for encrypted testflows or test programs containing encrypted testflows.
2. Open the **Profile Configurations** dialog from the context menu:
**Profile As > ****Profile Configurations**
3. Select Test Program from the objects pane on the left.
4. Click the New Launch Configuration [](https://lhc.advantest.com/uploads/images/gallery/2025-10/scaled-1680-/JLb10-png.png) button.
5. Enter a name for the new profile configuration in the configuration pane on the right.
6. In the Main tab (default selection), select **Enable license logging**. [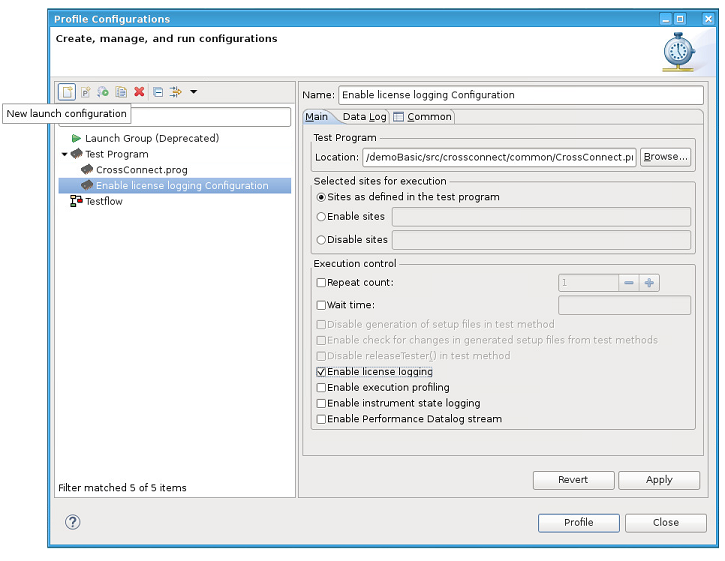](https://lhc.advantest.com/uploads/images/gallery/2025-10/scaled-1680-/NMg55-png.png)
7. Specify any other required configurations. For details, see [Creating a run configuration for running test programs or testflows](https://tdc.advantest.com/help/topic/com.verigy.itee.help.smartest.ui.8.7.6/256920.htm "You can specify, save and reuse customized configurations for starting test programs or testflows in execute or debug mode.").
8. Click **Apply** to save the profile configuration.
9. Click **Profile** to profile the testflow or **Close** to close the **Profile Configurations** dialog box.
### Results
License logging is enabled.
Log data is written to `/opt/hp93000/soc/system/log/licenseUsage_.log.`
A license usage log file contains the memory contribution (in Bytes) for each signal for each measurement.
Note: License logging can also be enabled and disabled using the Test Cell API.
For example:
`TestProgramConfig config; config.enableLicenseLogging = true; testProgram.loadWithConfig(config);`
For details about TestProgramConfig, see **[TestProgramConfig](https://tdc.advantest.com/help/topic/com.verigy.itee.help.smartest.ui.8.7.6/structxoc_1_1tcapi_1_1_test_program_config.html).**
### What to do next
The generated log file is user-readable and it is possible to manually extract the licensing requirements for memory and speed for each measurement within a test program. It is not essential to parse this file.
However, for further processing, it can be beneficial to parse the file to arrange its content into a more readable format.
To read in the data you can generate a parser based on the protobuf library using the grammar in:
`/opt/hp93000/soc/system/include/xoc/profiling/licenseUsage.proto`
For more details, see [Reading log file data](https://lhc.advantest.com/link/93#bkmrk-reading-log-file-dat-1 "Log file data contains information, such as memory usage.").
---
# Reading log file data
Log file data contains information, such as memory usage.
### About this task
If license logging is enabled, the license log data is written to: `/opt/hp93000/soc/system/log/licenseUsage_.log.`
The following log example shows the used memory (Pattern or PA = 1032 bytes) for the signal D04. The total accumulated value (`accDoubleValue`) is 3096 bytes which the total memory used by the complete program.
**LicenseUsage.log file example:**
```
measurementName: "Main.GlobalPAPattern.measurement"
measurementTimestamp: "Mon, 01 Jul 2019 15:30:08 -0700"
licensedFeatureLog {
featurePerSignal {
signalList: "D00 + D01 + D02 + D03 + D04"
feature {
feature: "speed"
accDoubleValue: 10000000
unit: "bps"
}
}
featurePerSignal {
signalList: "D04"
feature {
feature: "memory"
accDoubleValue: 3096
doubleValue: 1032
unit: "B"
}
feature {
feature: "sharedMemory"
doubleValue: 60352
unit: "B"
}
}
}
```
A license usage log file contains the memory contribution (in Bytes) for each signal for each measurement. The accumulated memory value is also recorded.
In the example above:
This file is in the protobuf (ASCII) format and can be read using a simple parser. For more information, refer to: [https://developers.google.com/protocol-buffers/](https://developers.google.com/protocol-buffers/)
Note: If you only require the values for a specific measurement, you can read this from the ASCII text manually.
The protocol buffer compiler is installed under `/usr/bin/protoc`.
The protoc version can be found with the command: `/usr/bin/protoc --version`
Output example: **`libprotoc 2.5.0`**
To structure information, protocol buffer message types are defined in .proto files. The following protobuf file is used for license logging, which can be compiled with the protocol buffer compiler to Java, Python, Objective-C, or C++.
### **Before you begin**
Make sure that license logging is enabled. For details, see [Enabling license logging](https://lhc.advantest.com/books/client-configuration-and-license-management/page/enabling-license-logging "Detailed information about license consumption and optimize license usage can be identified by License usage logging.").
### **Procedure**
1. Create a parser file, for an example, see [Example logfile parser](https://lhc.advantest.com/link/93#bkmrk-example-logfile-pars "The following code is an example parser for reading license log files and printing the top 10 measurement executions contributing to the specified feature and signal.").
2. For example, to compile to C++ with the protocol buffer compiler, run the following commands or a make.sh script containing the commands:
`protoc -I=/opt/hp93000/soc/system/include/xoc/profiling/ --cpp_out=. /opt/hp93000/soc/system/include/xoc/ profiling/licenseUsage.proto`
`c++ -std=c++11 -g -L/usr/local/lib -lprotobuf -o licenseLogger licenseUsage.pb.cc main.cpp`
The generated C++ class is used to simplify the parser implementation.
```
./licenseLogger licenseUsage.log memory D04
Analysing: licenseUsage.log memory D04
Top 20 measurement runs for feature "memory" at signal "D04"
Measurement Run | Value | Watermark Value
----------------------------------+--------------+-----------------------
Main.GlobalPAPattern2.measurement | 1032.000 | 3096.000
```
## Results
After the above `protoc` call or `make.sh` script is run, the following files are created:
**licenseLogger**
Generated Parser Executable To execute the **licenseLogger**, use the command:
`./licenseLogger `
For example:
`./licenseLogger licenseUsage.log memory D01`
**measurementLicense.pb.cc**
Generated after running **protobuf** compiler
**measurementLicense.pb.h**
Generated after running **protobuf** compiler
---
# Example logfile parser
The following code is an example parser for reading license log files and printing the top 10 measurement executions contributing to the specified feature and signal.
### Example parser (SmarTest ≥ 8.2.0)
```
#include
#include
#include
#include
#include
#include